

Oddly, my one and only interaction with Enoch Powell was during a seminar concerning the UK balance of payments statistics: he wanted their publication to cease; I did not. Following the release of the data for the first quarter of 2022, I imagine that many more politicians would be ready to advocate abolition. A quarterly trade deficit of £33.4bn, and current deficit of £51.7bn, are diabolical outcomes. For comparison, the annual trade deficit in 2021 was £29bn and current deficit, £60bn. While the new data is rife with measurement issues and should not be extrapolated, there are aspects of deterioration for which there is no excuse. The balance of payments data, like the painting of a grotesque image, may employ exaggeration, yet correctly identify an underlying distortion.
The data for 2019 is an obvious benchmark for our analysis: pre-Covid and pre-Brexit (31 January 2020). The Bank of England’s Sterling Index averaged 78 in 2019, similar to the current reading (figure 1). Currency movements offer no explanation for the disappointing trade performance. The latest figures for trade volumes (figure 2) confirm that UK exports to the EU remain 5.5 per cent below the 2019 benchmark, while exports to non-EU are 22.8 per cent lower. Import volumes from the EU are 3.7 per cent higher than the 2019 average and from non-EU countries, 13.8 per cent higher. Only in crude materials and material manufactures has the UK achieved relative improvement in both EU and non-EU trade.
Significantly, it is the UK trade performance with non-EU countries that has contributed most of the deterioration. The UK’s fading role as an energy exporter and increasing dependence on energy imports has weighed heavily on the data. Weaknesses in chemicals and miscellaneous manufactures are harder to justify. However, the substantial tilt to goods consumption over services consumption during the Covid-affected years has clearly raised the UK’s import propensity in respect of goods. In 2019, the visible trade deficit in chained volume terms was £138bn; the deficit in the 3-months to April is an annualised £237bn. In value terms, the £138bn deficit would become £266bn!
In summary, the UK has been outmanoeuvred in the past 3 years; other countries have adapted better to the challenges and opportunities of Covid and the UK has had the additional hurdle of the post-Brexit trade transition. While the mayhem of 2020 briefly lifted the combined UK goods and services balance into surplus, the resumption of familiar patterns of consumption and investment has left the UK in even deeper deficit. Our traditional surplus in services trade is improving, largely due to weakening services imports, but at a pace which is no match for the burgeoning goods deficit. The external data that arrived last week is a stark reminder of the ground we have forfeited. Public sector expansion is no substitute for private sector contraction.
Figure 1: Bank of England Sterling Index
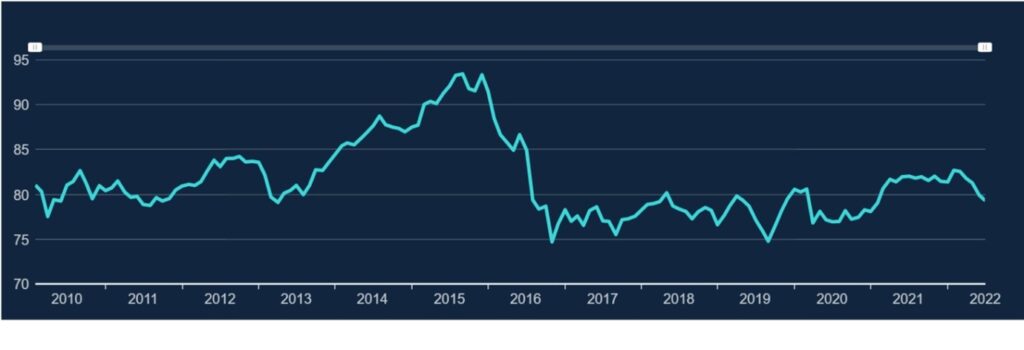
Figure 2: UK visible trade performance (using chained volume data)
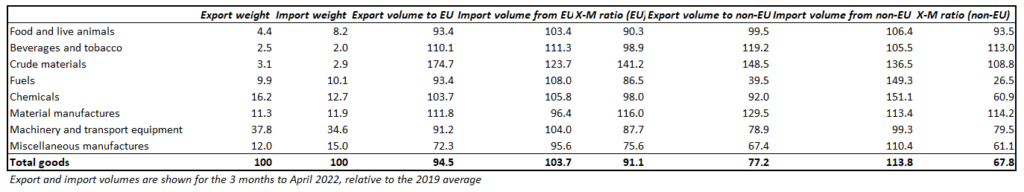
Data Source: UK trade statistics, ONS