

The sky is black with chickens coming home to roost. As the reality of the UK’s inflationary struggle dawns, borrowers large and small are waking up to the prospect of ‘higher for longer’. We appear to have been living in a twilight zone in which it has been possible to pretend that higher interest rates would no longer be necessary. This has persuaded some to take revolving credit at penal interest rates to tide them over until rates drop back down. Until late March, this narrative was supported by falling 2-year mortgage rates, mirroring the movement of 2-year gilt yields. The upward lurch in yields, to levels that exceed those reached during the LPI/Truss debacle in late-September, has exploded the myth that everything would soon settle down. Official sources have added to the illusion by suggesting that falling fuel price inflation would bring an early and decisive collapse in UK headline CPI inflation. Not so.
According to the Institute of Fiscal Studies, over 14 million adults aged 20 and over, representing around a third of the total, have a mortgage, including just over half of 30- to 50-year-olds. Many have fixed rate mortgages and so are shielded from rising interest rates in the short run. But those fixed terms will end, sooner or later, and they too will be exposed to much higher rates, implying a jump in monthly repayments. The average 2-year fixed rate mortgage now stands at 6.1 per cent, up from 2.65 per cent in March 2022. The IFS reckons that the average hit to disposable incomes from the rate reset will be more than 8 per cent (figure 1), with a 20 per cent hit for a sub-group of 1.4 million mortgagors. Overall, 60 per cent of those with a mortgage are set to spend more than a fifth of their incomes on mortgage payments, compared to only 36 per cent of borrowers in March 2022 (figure 2). The average first-time buyer needed to devote 37 per cent of their income to finance a mortgage in the first quarter of this year.
The extent of the impact of the interest rate reset in macroeconomic terms is harder to judge. Obviously, the higher rates paid on bank and building society deposits will boost the interest incomes of millions of people, even as the payments of mortgage borrowers escalate. However, one measure of the net impact is the share of FISIM (financial intermediation services indirectly measured) in gross household disposable income, shown in figure 3. This uses quarterly data. It has increased from 1.7 per cent in 2021Q3 to 3.2 per cent in 2022Q4, with a likely peak above 4 per cent. In broad terms, the increased absorption of disposable income would appear to require additional resources equivalent to around 2 per cent of income, or a similar proportionate cut in expenditures.
Unlike the government’s response to the pandemic or the ‘cost of energy crisis’, there is no likelihood of a relief package using taxpayer funds for embattled mortgagors. When they took out their loans, the lender would have been required to stress test their finances to ensure they could withstand a 3-percentage point increase in the initial interest rate, but many borrowers will have less resilience today than when the mortgage was granted. How will households find the extra disposable income to meet the higher mortgage payments? Many will have liquid savings that they can draw upon to buffer the transition without disrupting their spending patterns. Some will look to family members to provide short-term assistance. Others will seek to withdraw equity from their homes, but the terms are unattractive. However, in almost all cases, other categories of consumer spending will be trimmed. The scale of these economies – to meals outside the home, leisure and entertainment, hotels and other recreation activities – is yet to be understood.
Figure 1: Average increase in mortgage payments for adults in mortgagor households, by age
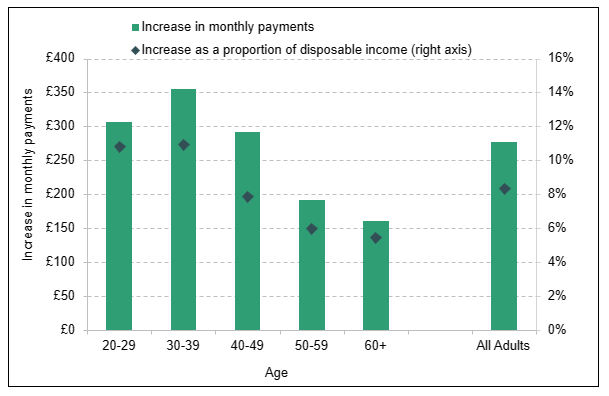
Source: Institute for Fiscal Studies
Figure 2: Proportion of family income spent on mortgage payments, by age; including non-mortgagors
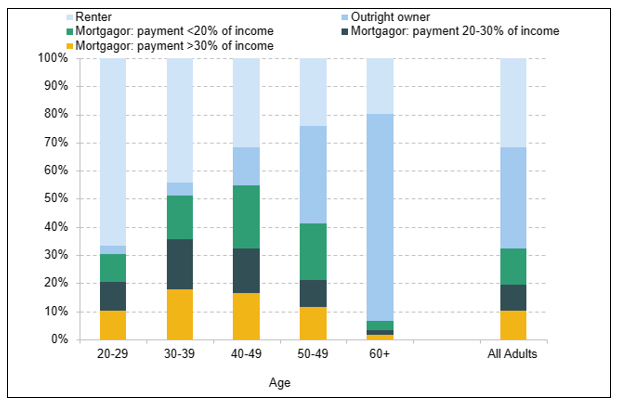
Source: Institute for Fiscal Studies
Figure 3:
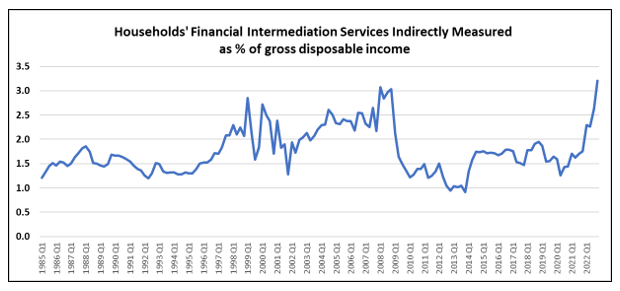
Data source: ONS