

In a financialised economy, debt mimics, even constitutes, a factor of production. Consumer credit finances the marginal purchase of consumer goods and services; corporate borrowing finances the marginal purchase of capital goods, while government borrowing finances the shortfall of its revenues in relation to its expenditures. When governments run large budget deficits, either they are implicitly funding larger private sector purchases than would otherwise occur, whether through tax allowances and exemptions, grants, and subsidies, or they are funding public sector expenditures. This behaviour is only justifiable if national income grows by at least as much as the debt increment, a condition rarely satisfied in the US for 40 years.
The US Bureau of Labor Statistics recently announced that labour productivity in the private non-farm business sector grew by 1.3 per cent in 2023, only slightly below its post-2007 annual average rate (see figure 1). The drivers were identified as an increase in total factor productivity (sometimes known as disembodied technical progress) of 0.7 percentage points and an increase in capital intensity of 0.6 percentage points. On the back of this, and subsequent, data releases, the European economies have been berated for their woeful productivity performance in relation to the US.
How impressed should we be by US productivity growth that has been so clearly juiced by a quickening pace of public sector debt accumulation? During the pandemic, general government debt jumped by 21 per cent in the year to 2020Q4, hovered around 6 to 7 per cent growth in 2021-22, dipped to 4 per cent in early 2023 before rebounding to 8.8 per cent in the final quarter. Extensive tax reliefs and subsidies have spurred a vigorous rebound in nominal business investment. Thanks to the power of hedonic price adjustments, the sizeable portion of this investment allocated to technology hardware and software shows up even more strongly in real GDP and in standard productivity measures.
The marginal productivity of US domestic non-financial debt is charted in figure 2. Over the past 40 years, it has averaged about 0.4, meaning that it has taken US$2.50 of net new borrowing to achieve US$1 of added national income and output. However, a radical change in the composition of domestic non-financial debt has been underway since the 2008 financial crisis: the public debt share has leapt from 27 per cent to 44 per cent (figure 3). The government has been instrumental in propping up failing economic systems and providing insurance services to both workers and businesses. While there is evidence to support the proposition that the marginal productivity of private non-financial debt has recovered over the past couple of years, this is not discernible in the aggregate.
The interest rate reset that began in 2022 poses a significant threat to unproductive debt. As an ever-larger proportion of the debt increment is represented by rolled-up interest and the covering of losses in failing businesses, so the proportion available to finance a higher level of spending will shrink. The scale and incidence of bankruptcy and debt delinquency is set to rise, anticipating a new credit crisis. The US is exercising exorbitant privilege in its use of public debt, but this is not the path to prosperity.
Figure 1:
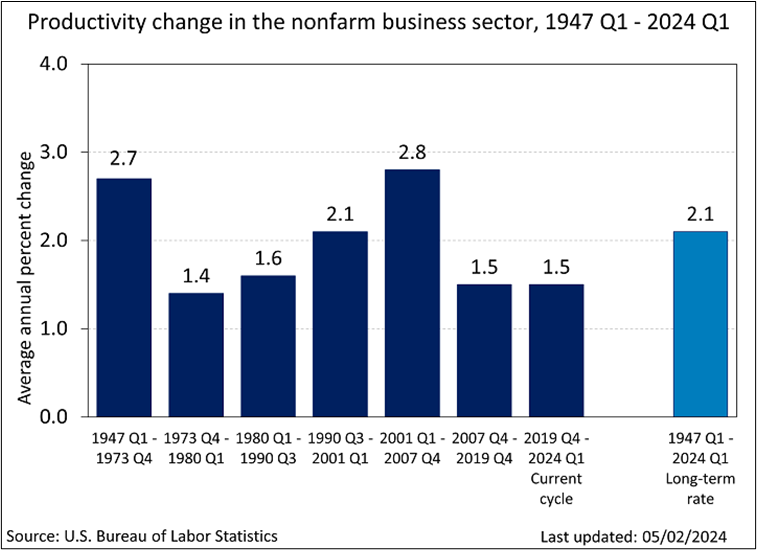
Figure 2:
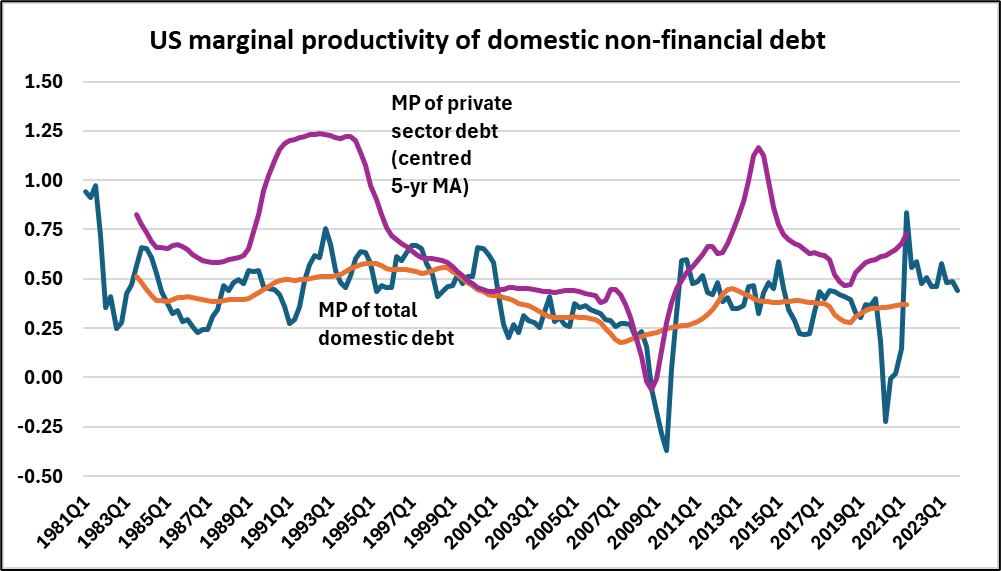
Data source: US Federal Reserve, Z1
Figure 3:
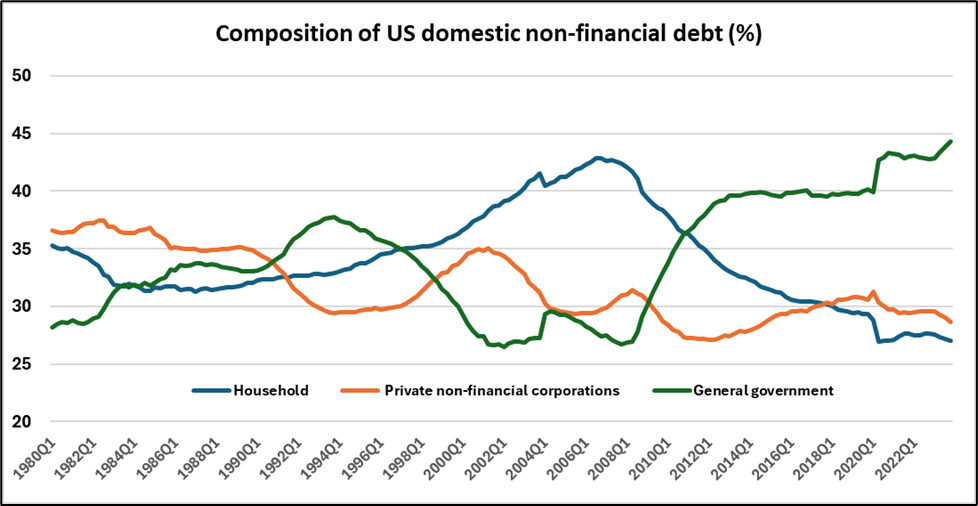
Data source: US Federal Reserve, Z1