Long, long ago, it was believed that the only lasting foundation for wealth creation and future prosperity lay in the sacrifice of current consumption. Long before insurance companies were established, thrifty societies regarded a high saving rate as the best protection against adversity and the best strategy for economic success. John Wesley’s famous dictum¹ was to “earn all you can, save all you can and give all you can”. It is extraordinary and deeply concerning that, since 2007, UK national saving no longer covers the cost of capital consumption in a typical year. Our net national saving rate is barely positive in a good year and meaningfully negative in a bad one. The real growth in the capital stock – broadly defined – is increasingly facilitated by foreign finance and overseas ownership of the underlying assets.
The UK is not alone in this predicament. Throughout the English-speaking world and in many other countries, the net national saving rate has marched steadily downhill since the 1970s. The US suffered a plunge in its net saving rate in the early 2000s (figure 1), as it battled with recession, and when the global financial crisis arrived in 2007, the rate turned negative for 3 consecutive years. There followed a spirited recovery, but the legacy of the Covid era has left net saving languishing once more.
Figure 1
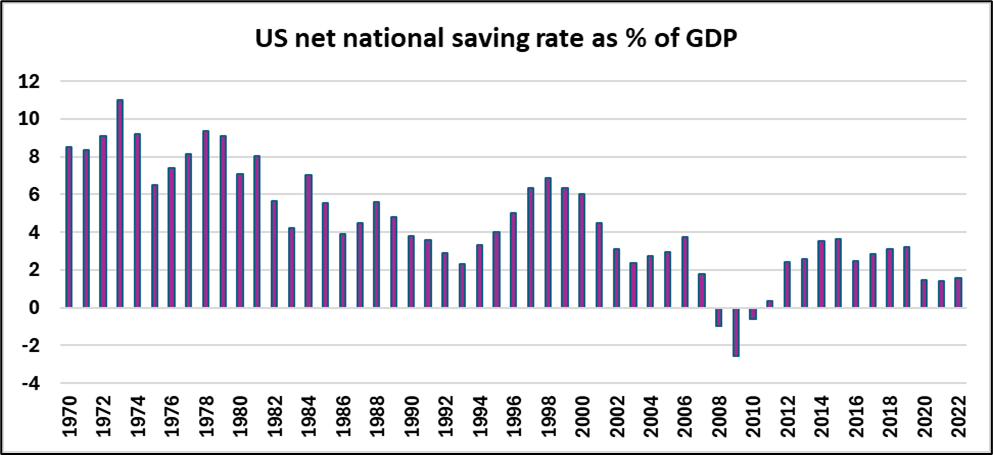
Data source: OECD Main Economic Indicators database (B8n, B1gq)
However, compared to the US, the UK net saving rate (figure 2) fell more significantly in 2007 and remained negative for the next 9 years. Ironically, the Covid years delivered the best net saving outcome in almost 20 years, but it has proved short-lived. The so-called “excess saving” resulting from a mandated abstinence from opportunities for physical consumption – but not online ordering – was an indictment of the generosity and persistence of the furlough payments and other emergency measures funded from the public purse.
Figure 2
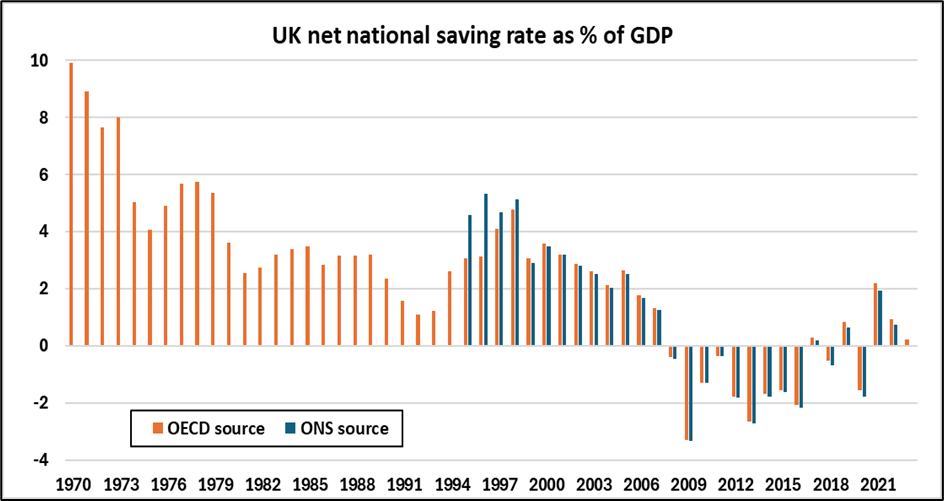
Data sources: OECD Main Economic Indicators database, ONS (B8n)
In his poem, Annus Mirabilis, the late Philip Larkin famously asserted² that “sexual intercourse began in nineteen sixty-three (which was rather late for me)”. Less controversially, students of the UK national accounts remember 1963 as the year from which quarterly sectoral financial accounts were first published. These accounts offer an insight into the varying sectoral contributions to the decline in the net national saving rate. For reasons unknown, the consistent series currently provided by the ONS extends only to 1987. Figure 3 reveals that the secular deterioration in the national net saving rate is explained mainly by the weakening contribution from the household sector (labelled H/h+NPISH).
Figure 3
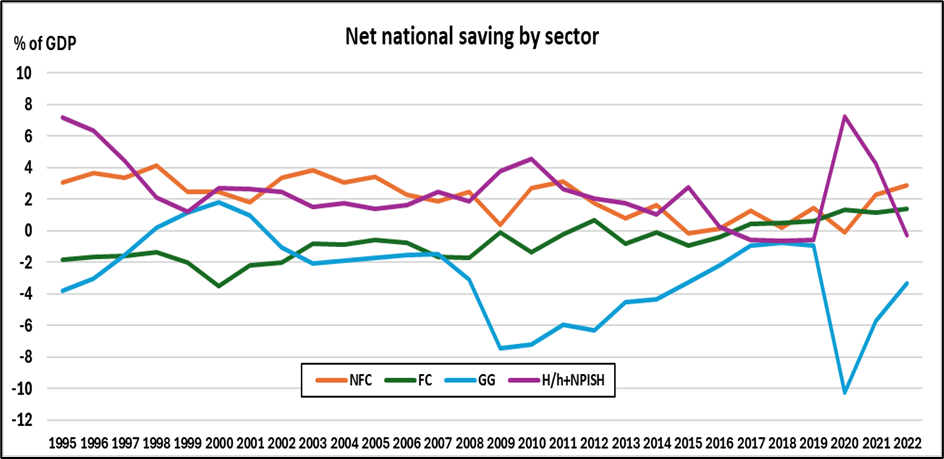
Data source: ONS
While there have been two severe episodes of dissaving by the public sector, these have had remarkably little impact on the national net saving rate. It turns out that when central and local government dissaves, there is a near-total offset from private sector saving. Figure 4 uses the correlation coefficients for the gross (of capital consumption) saving data (shown in the appendix) but the results are similar to those for net saving: households and companies save more when governments run deficits, and save less when they run surpluses.
Figure 4
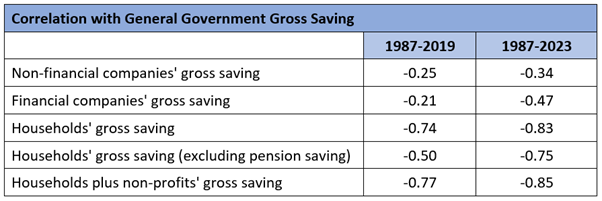
Data source: ONS national accounts
The key to a higher net saving rate is a (modestly) positive real interest rate on capital-protected savings. The mandating of higher personal or corporate pension contributions has proved ineffective in this regard. Consumers who are well-versed in the use of credit will offset their contractual saving with additional borrowing as they see fit.
Arguably, the most significant development in the national net saving story in the US and the UK was the arrival of one Alan Greenspan, alias the Saving Saboteur, at the helm of the US Federal Reserve in 1987, through to his departure in 2006. From 1994 onwards, he declined to tighten monetary policy sufficiently to stabilise the US economy, fearing the consequences for global financial stability. His legacy is the undermining of the incentive to save in capital-safe instruments, reinforced by the policies of his successors, which have been transmitted around the world due to the massive influence of US monetary policy. The switch to a model of wealth creation through leveraged financial structures and capital appreciation of real estate and financial assets has downgraded the appeal of low-yielding savings instruments, although the interest rate reset of 2022-23 has sparked something of a revival.
The path to a stronger UK economy lies through the vale of a period of significant consumption sacrifice – of maybe 2 to 5 percent of GDP. Until the UK recovers a positive net saving rate – and an accompanying positive net rate of domestic capital formation, then government ministers will wring their hands in frustration at the failure of their ‘growth strategies’.
¹https://www.wussu.com/poems/plam.htm
²https://christianhistoryinstitute.org/magazine/article/wesleys-sermon-use-of-money
Appendix
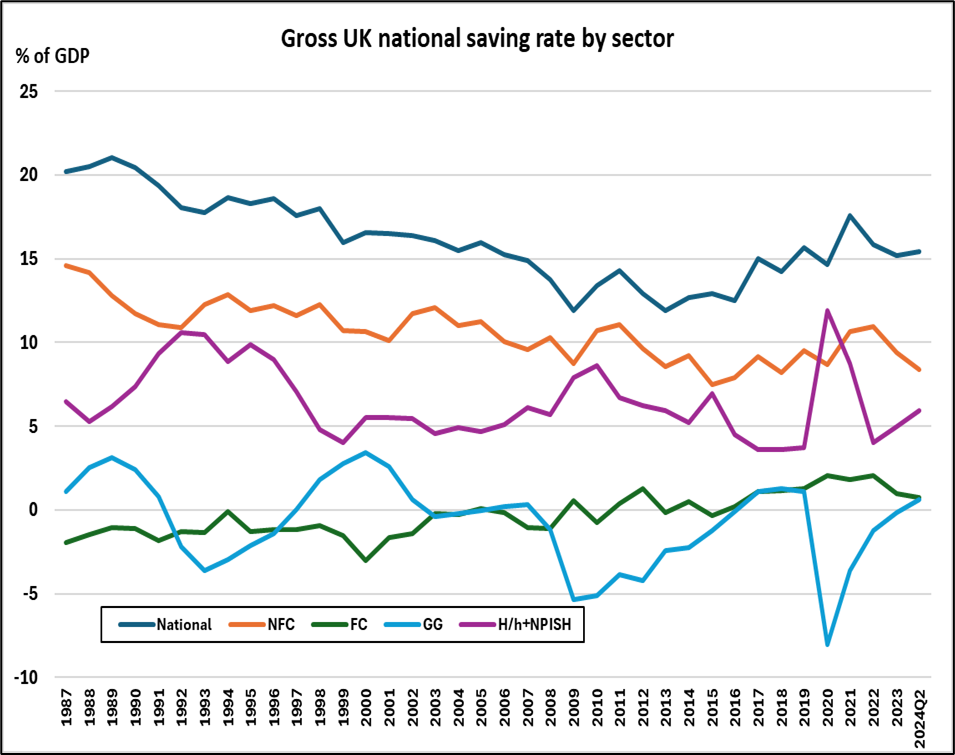
NFC – Non-financial companies
FC – Financial companies
GG – General government (central and local)
H/h – Households
NPISH – Non-profit organisations serving households

