The UK consumer made a spirited recovery after its cardiac arrest in March 2020, and survived another serious relapse in early 2021, but the patient has not sustained this recovery. Month by month, its vital signs are weakening, even before the shock of Ukraine. Recovering heart patients do not respond well to the sudden arrival of bad news. Last week’s retail sales data confirms that no market segment looks in great shape, with particular concern that the online shopping boom is unravelling. April’s data will reveal, to a fuller extent, the range of compromises that consumers are being forced to make as they confront a barrage of price, tax, and interest rate increases. Mainstream forecasts have failed to adjust to this reality, yet they must.
A family member recently sent me a spoof video clip of a “Manchester United Mindfulness Centre” where the tutor engages with a small group of United fans to explain that “Man United just aren’t a very good team anymore” and to lower their expectations of what might be achievable, even with a new manager in charge. I feel the same way about the UK consumer. Rishi Sunak (anagram of “UK is shairn*?”) is fond of pointing out that the UK was top of the G7 GDP growth league table in 2021 but expect to see its rankings tumble in 2022 and 2023 (already the worst, according to the IMF forecast). Whether or not the chancellor vacates his position soon, the outlook for Consumer Spending United is rather poor, after adjustment for inflation.
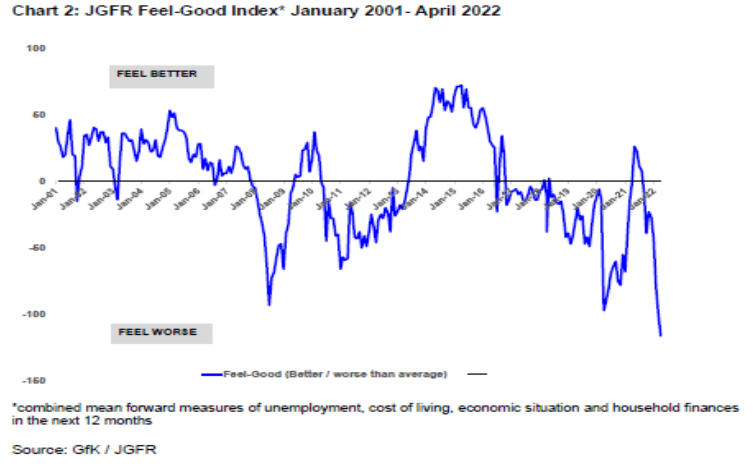
In a nutshell, the online fad is fading, the replacement cycle for household goods peaked last year, the rocketing price of fuel has put a dampener on vehicle use and Covid still casts a long shadow. Taking a longer perspective, households have been piling on the debt again since 2014 and have become increasingly reliant on rock-bottom borrowing rates. The Treasury’s argument for robust consumer spending growth this year was based on much lower inflation forecasts, minimal change in policy rates, and an aggressive depletion of savings. Fourth quarter accounts estimate a 6.8 per cent household savings ratio (or 5.5 per cent on a cash basis), compared to a 5 per cent average in 2018 and 2019, suggesting that there is limited scope for savings rate reduction, and even less wisdom, in the light of the very downbeat consumer mood (see figure 1).
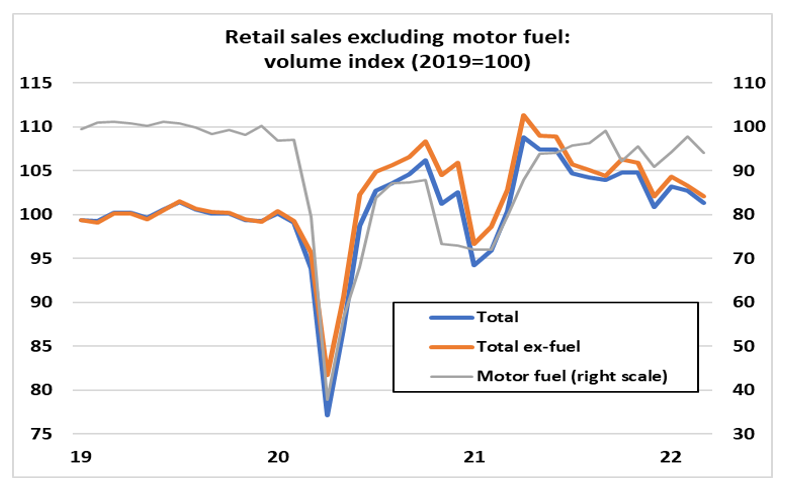
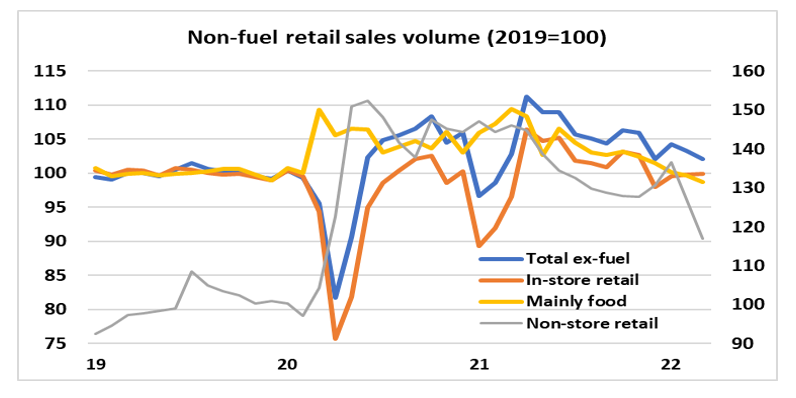
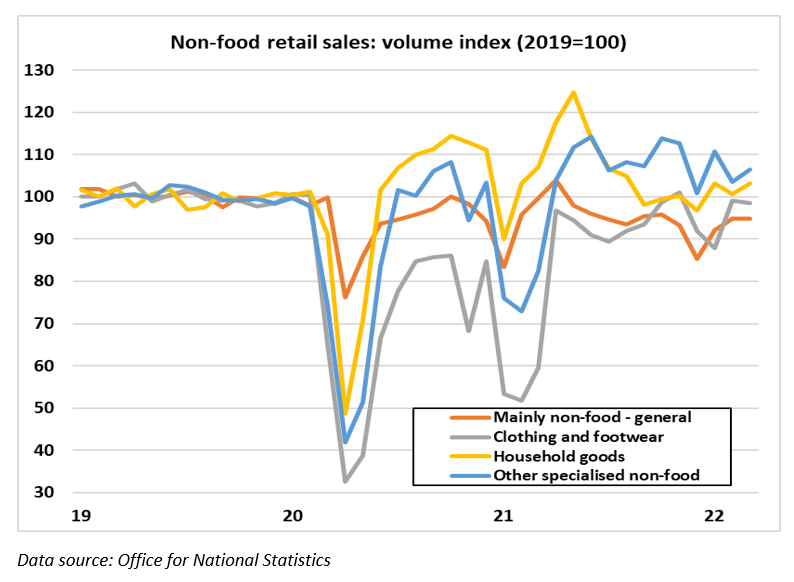
As is obvious from the charts, it makes no sense to analyse annual growth rates of retail sales volumes, which are still all over the place. Figures 2 and 3 show that the momentum in retail sales volumes is ebbing. In aggregate, non-food sales have stronger trends than food sales, and specialised non-food stores are outscoring department stores. Floor coverings, medical goods and second-hand goods have made spectacular advances over the past couple of years, but they have tiny weightings. In terms of sub-categories that are still holding on to post-Covid gains, the most impressive are gardening and pet-related spending (up by 16 per cent since 2019) and hardware, paints, and glass, up by 13 per cent. (When pet, garden and DIY expenditures fall back, then we’ll know that things are tight.) Sterling suffered a sharp fall when these retail sales figures were published last week. The pound has dropped, but we’re still waiting for the penny to drop.
*Shairn is Scottish for cow dung.
Figure 1:

Figure 2:

Figure 3:

Figure 4:


