

The release of the full national accounts for 2022 has confirmed what an extraordinary year it was for the UK economy. Already twisted out of shape by Brexit and Covid, hopes of normalisation were sideswiped by the repercussions of the invasion of Ukraine. The picture that emerges is a not a Constable; more like a Picasso – or a Bosch. Four major themes are visible: consumer retrenchment, corporate resilience, supply-side constriction, and public sector dysfunction. While businesses have the physical capability and financial strength to underwrite an economic recovery, it is not at all clear why they should bother.
The optimistic view of household finances in 2022-23 was that the Covid savings windfall that occurred in 2020 would act as a bolster for consumer expenditures even as tax burdens rose, extraordinary payments ended, and social protection was frozen in real terms. Figure 1 suggests that the discretionary saving rate is falling very sharply and may hit zero before the end of 2023. The tightness of the labour market was expected to deliver modest improvements in real wages and an associated increase in the share of wages in national income. In reality, real earnings inflation has been negative and the wage share has fallen back from 42.6 per cent in 2020 to 41.1 per cent in the final quarter of 2022. Combined expenditures on food, drink, alcohol and tobacco have dropped by more than 10 per cent in real terms since the first quarter of 2021. Consumer retrenchment is broadening its reach, month by month.
In contrast, the corporate and unincorporated business sectors exhibited an impressive resilience to the various economic and financial challenges. Private non-financial corporations boosted their profits by 14 per cent in the year to the fourth quarter, financial corporations lifted theirs by 15 per cent and the mixed income and operating surplus of the non-corporate sector rose by 12 per cent. This was reflected in buoyant fixed investment data: an 11 per cent gain for business investment, including a 30 per cent jump for transport equipment, 9 per cent for ICT and other machinery and equipment and 6 per cent for buildings and structures.
On the supply side, the enthusiastic recovery of manufactured output ended in the second quarter of 2021. In January 2023, output of consumer durables was down 11 per cent, year-on-year, intermediate goods, 9 per cent, capital goods, 5 per cent and energy 3.6 per cent. Output of the distribution, hotels and catering, and repairs sectors has stagnated at 88 per cent of the 2019 base. Mining and quarrying production is weaker still. The UK’s indifferent output performance is a hindrance to recovery as domestic demand is increasingly satisfied from imports. After netting off the “acquisitions less disposals of valuables” item, the trade balance deteriorated from near-balance in 2020 to minus £21bn in 2021 and minus £71bn in 2022. In round terms, UK domestic expenditures boosted GDP by 2.6 percentage points in the year to Q4 2022, but the widening trade deficit reduced this to 0.6 per cent. There is no point in boosting demand in a supply-constrained economy.
During 2022, the volume of health expenditure fell by 3.7 per cent as Covid-related spending receded and the real cost of social protection held steady. However, the overall spending burden remained close to its highest level as government expenditures – other than health, education, social protection, justice and fire and military defence – surged by 13.6 per cent in real terms. The public sector has grown significantly since the pandemic, yet the output of government and other services is more than 6 per cent below its pre-pandemic benchmark. Effectively, the UK has reallocated resources from sectors with low, but positive productivity growth, to ones with seemingly declining productivity. The dysfunctionality of the public sector is contaminating the economy and inhibiting growth. While companies can afford to boost investment and output, the pressing question, is “why would they?”
Figure 1:
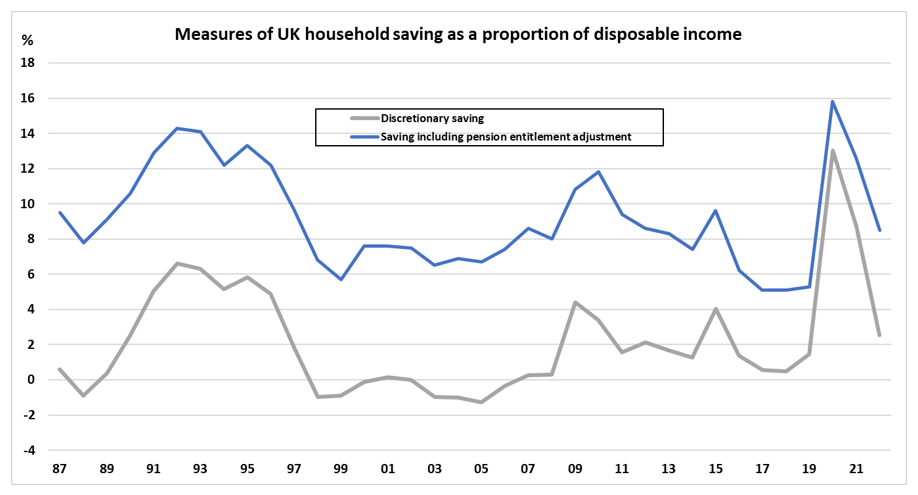
Source: ONS
Figure 2:
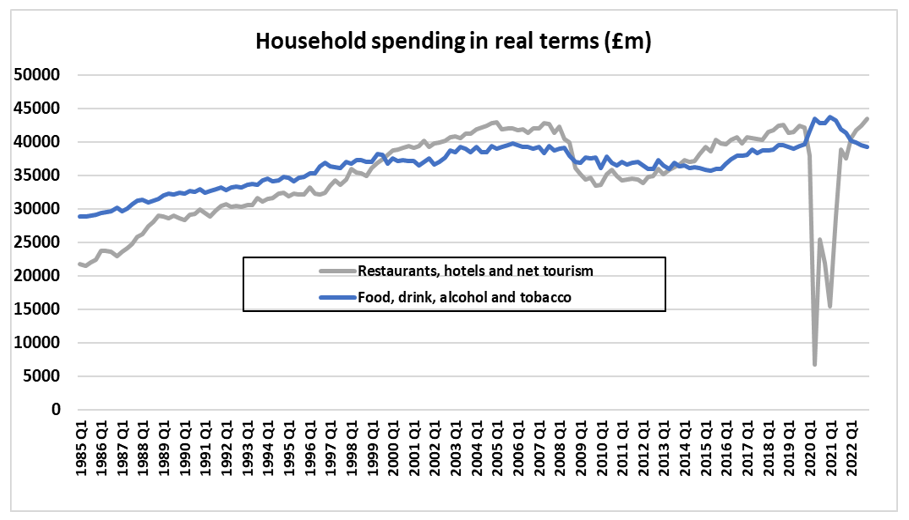
Data source: Office for National Statistics