For those schooled in the generalised benefits of international trade, the past 15 years have been a source of dismay and consternation. The compound annual growth rate of merchandise trade has fallen from 5.3 per cent (2000-2008) to 1.8 per cent (2008-2023). Even as global GDP per head is rising, the world appears to be shrinking. Nations are retreating into regional shells, global corporations are having to finance their own supply chains and, worst of all, physical trade is under growing threat from military and terrorist attack. The global economy, as currently constituted, requires vast volumes of fuel, food, consumer and capital goods to be moved between, as well as within, continents. The constriction of world trade is unequivocally bad news for global growth, like a spanner in the works.
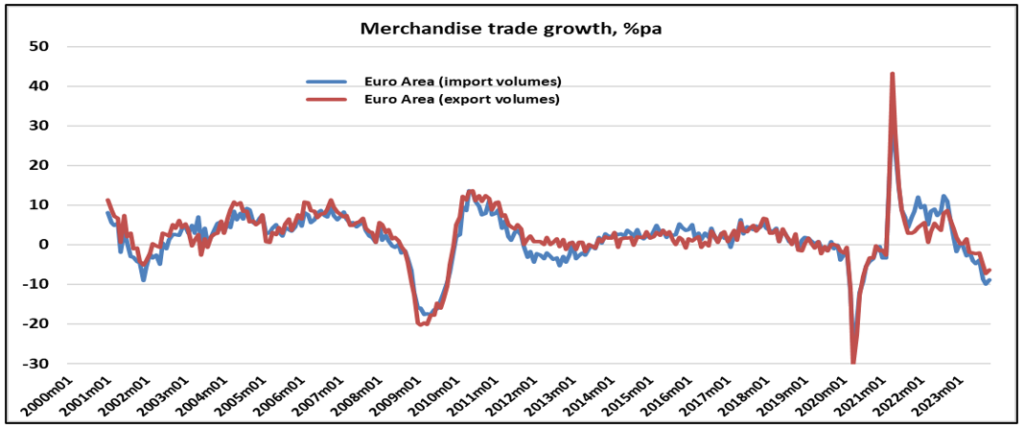
The best example of the tortoise syndrome is, sadly, the UK (where export volumes are down 20.2 per cent and import volumes down 11.5 per cent on 4 years ago), followed by Eastern Europe (export volumes are down 7.4 per cent and import volumes down 21.1 per cent on 2019). The Euro area (imports up 0.3 per cent, exports down 0.8 per cent) also shows tendencies in this direction. Regionally, China (figure 1) sports the best 4-year growth rates (imports, 13.5 per cent; exports, 22.5 per cent) but these are still well down on the double-digit annual percentage growth rates that were typical of the pre-Covid era. Advanced Asia (excluding Japan) and emerging Asia (excluding China) are the next-best performers over the 4 years to October 2023.
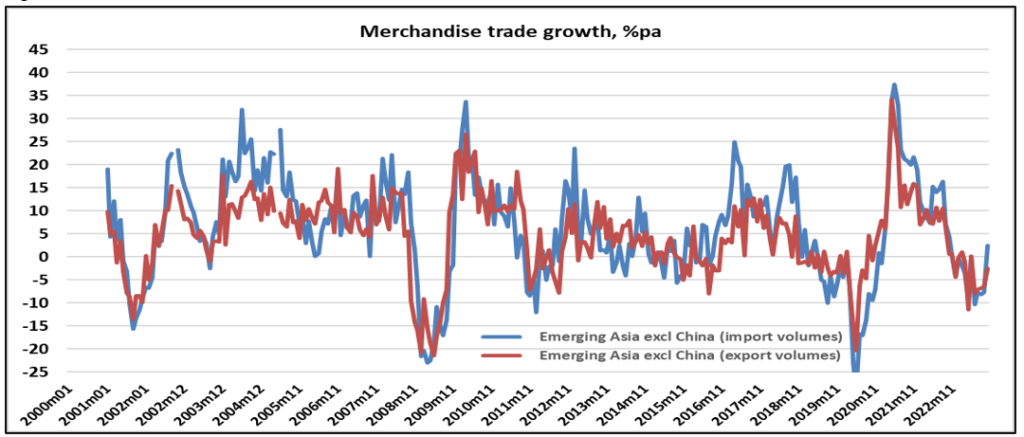
It is looking extremely likely that 2023 will turn out to be a year of world trade recession, led by advanced economies (figure 2). In terms of momentum, the annualised 6-monthly growth rate of merchandise world trade volumes is a mere 0.6 per cent, suggesting that we enter 2024 without a following wind. Other widely used indicators, such as the volatile Baltic Dry Index (figures 3 and 4), confirm that shipping rates are back to where they were 3 months ago, after an end-year spike. Beneath the surface of this stagnation, emerging Asia (excluding China) is the clear leader (figure 5), followed by advanced Asia (excluding Japan). The US has strong export momentum. At the opposite end of the scorecard, Eastern Europe brings up the rear, followed by Africa and the Middle East, the Euro Area (figure 6) and the UK.
The consequences of dismantling long, thin supply chains, substituting costlier regional sources for more distant ones, onshoring manufacturing when it makes no economic sense to do so, abandoning trade fairs and expos as an unjustifiable expense etc., will be a contraction of the global economic opportunity set, the forfeiture of the gains from trade and the bolstering of local monopoly power as foreign competitors withdraw. Throw in a rising geopolitical risk premium arising from the Russia-Ukraine war and escalating tensions in the Middle East, and it is conceivable that 2024 could be a second consecutive year of weakening merchandise trade volumes.
Figure 1:
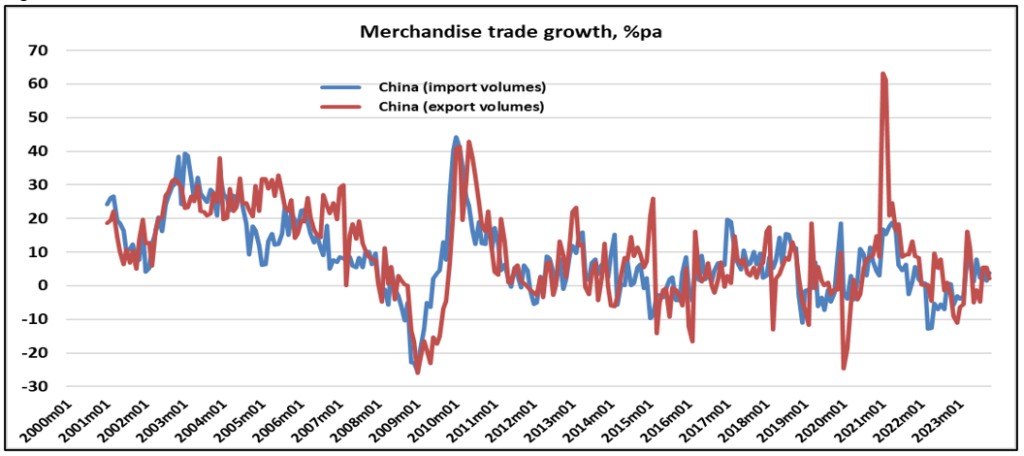
Data source: CPB World Trade Monitor
Figure 2:
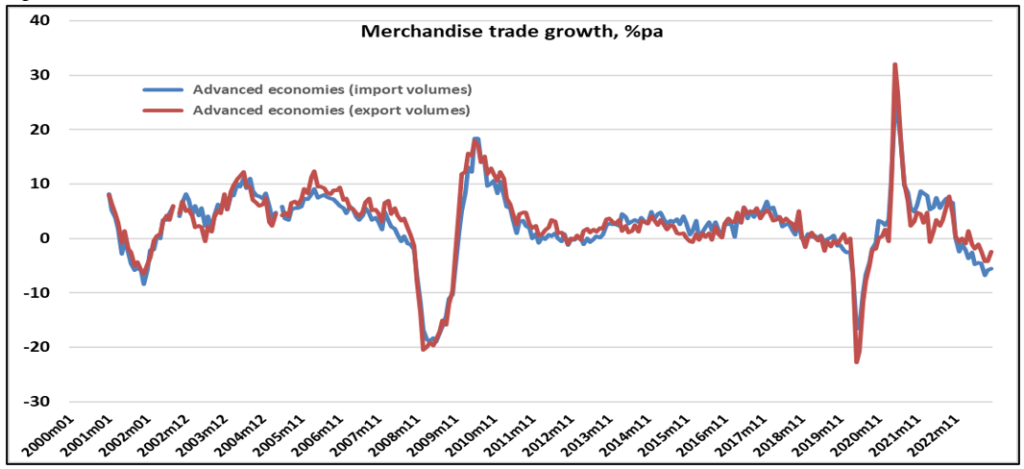
Data source: CPB World Trade Monitor
Figure 3:
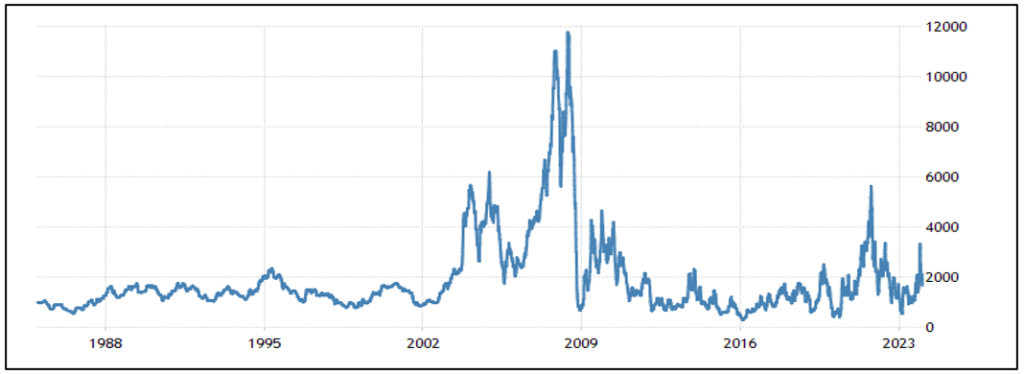
Source: Marine Vessel Traffic
Figure 4:
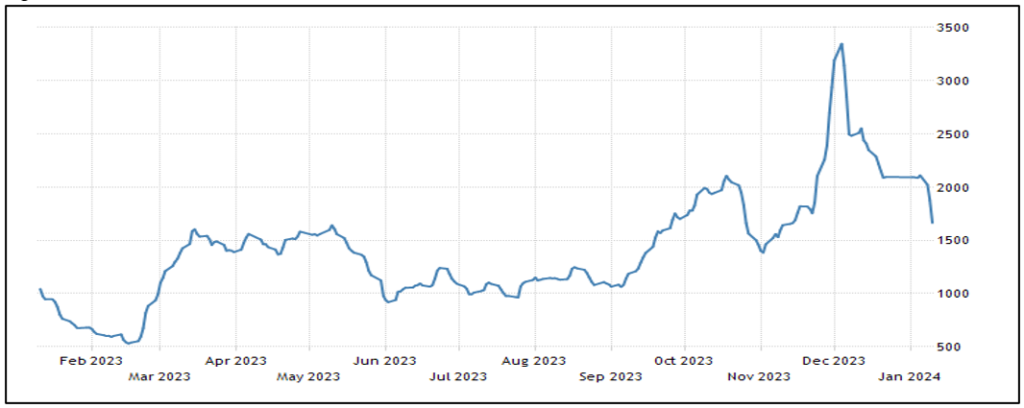
Source: Marine Vessel Traffic
Figure 5:
Data source: CPB World Trade Monitor
Figure 6:
Data source: CPB World Trade Monitor

