

Over the past 30 years, we have grown used to seeing historical relationships of economic and financial variables at record extremes, as the audacious use of leverage has increased the amplitude of oscillation around long-term averages. Our ability to rationalise these departures offers cold comfort, since we must live with the threat of abrupt reversal and concomitant wealth destruction. The entire configuration of interest rates and asset prices looks to be distorted, as if the whole world were on a tilt. Expected returns appear heavily skewed to the downside. What would it take to right the ship?
I offer five exhibits in support of the hypothesis that the ‘world is on a tilt’. First, the muted reaction of real household consumption to the brutal increase in interest rates that began in the Spring of 2022. This can be explained, in part, by the asymmetric effect of short-term interest rates on borrowers and savers. Most mortgage borrowers were shielded from rising interest rates by the fixed rate deals they had entered, while savers were invested predominantly at variable rates. As Russell Napier has observed, the “grey Pound” – and grey Dollar – are helping to keep spending levels from slipping. A second mitigating factor is the buffer of involuntary saving during Covid-19, now substantially depleted in most cases. A third factor of particular importance in the US, is the recent enhancement in the household wealth-to-income ratio, which encourages stronger current consumption and weakens the propensity to save.
Second, where is the lasting compression of price-earnings ratios that typically accompanies a surge in inflation? (see figure 1). True, the P/E ratio for the S&P500 (figure 2) collapsed from 36.9 in November 2020 to 19.2 in September 2022, but why has it rebounded to 26.3 so quickly, when it is far from certain that inflation has been brought under control? One of the explanations offered is the time-honoured central bank put: the notion that the “Fed has the market’s back”. Another favourable factor is the buoyancy of bank lending to the financial sector, enabling investors to finance their equity positions cheaply.
Third, where is the widening of corporate credit spreads that reflects the rising probability of default and increasing uncertainty over economic outcomes? Despite an increase in the global incidence of corporate insolvency and personal bankruptcy, corporate debt remains highly valued. Again, a mitigating factor is the locking-in of low fixed borrowing rates before 2022. Another is the migration of the weakest credits from public markets into private ownership.
Fourth, where are the rising charge-off rates for bank loans in the over-indebted sectors such as commercial real estate and private equity? Surely, somebody must be feeling the pain of sharply higher interest rates?
Fifth, how come that US equity options volatility (VIX), shown in figure 3, and the volatility of volatility (VVIX) are sitting at such tranquil readings? With equity valuations so high and with more general measures of political, economic, and financial uncertainty tracking higher (see figure 4), why is the VIX close to its all-time lows?
In an important year for global elections, the political preference for stability, calm and a rising stockmarket is obvious. But suspicions remain that the phased re-setting of interest rates, as fixed rate arrangements expire, will trigger a cascade of economic and financial pain that is, as yet, unpriced in financial markets. In which case, the passage of time is a sufficient catalyst for the righting of the ship.
Figure 1:
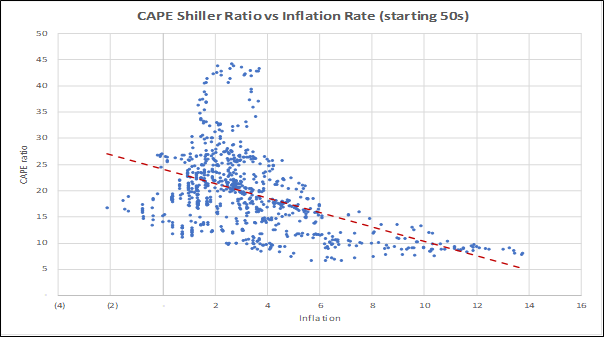
NB Using data from January 1950. CAPE is Cyclically-Adjusted PE
Data source: Robert Shiller’s website (http://www.econ.yale.edu/~shiller/data.htm)
Figure 2: P/E ratio of the S&P500
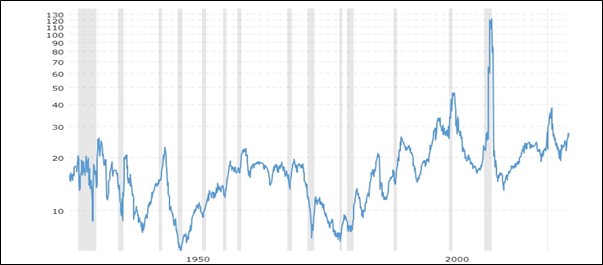
Data source: Macrotrends
Figure 3:
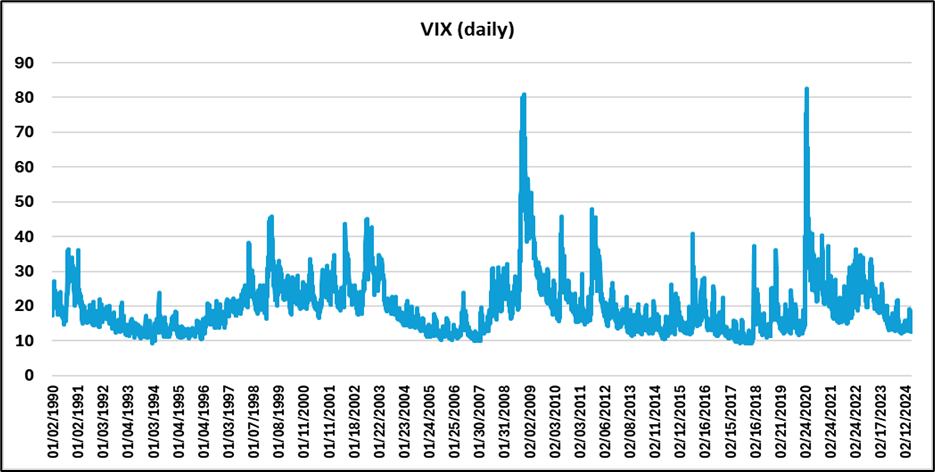
Data source: CBOE
Figure 4:
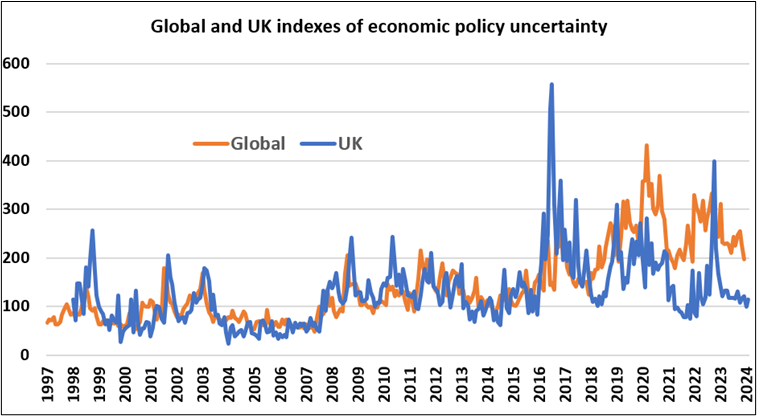
Data source: Davis, Steven J., 2016. “An Index of Global Economic Policy Uncertainty,” Macroeconomic Review, October.